

The Dashboard
Your Home dashboard, laid out the way you want, with metrics from every part of careCycle and charts you build just by asking.
The Dashboard is the first thing you see when you log in. What's on it depends on who you are:
- Owners and Admins get the Home dashboard: a board of metrics you can rearrange, add to, and build your own charts for. That's most of this page.
- Everyone else (agents, managers, CSRs) gets the agent dashboard, which is all about their own queue and numbers. See Agent dashboard below.
By default only Owners and Admins see the Home dashboard. If you want someone else to have it, give them a custom role with dashboard access. See Roles and Permissions.
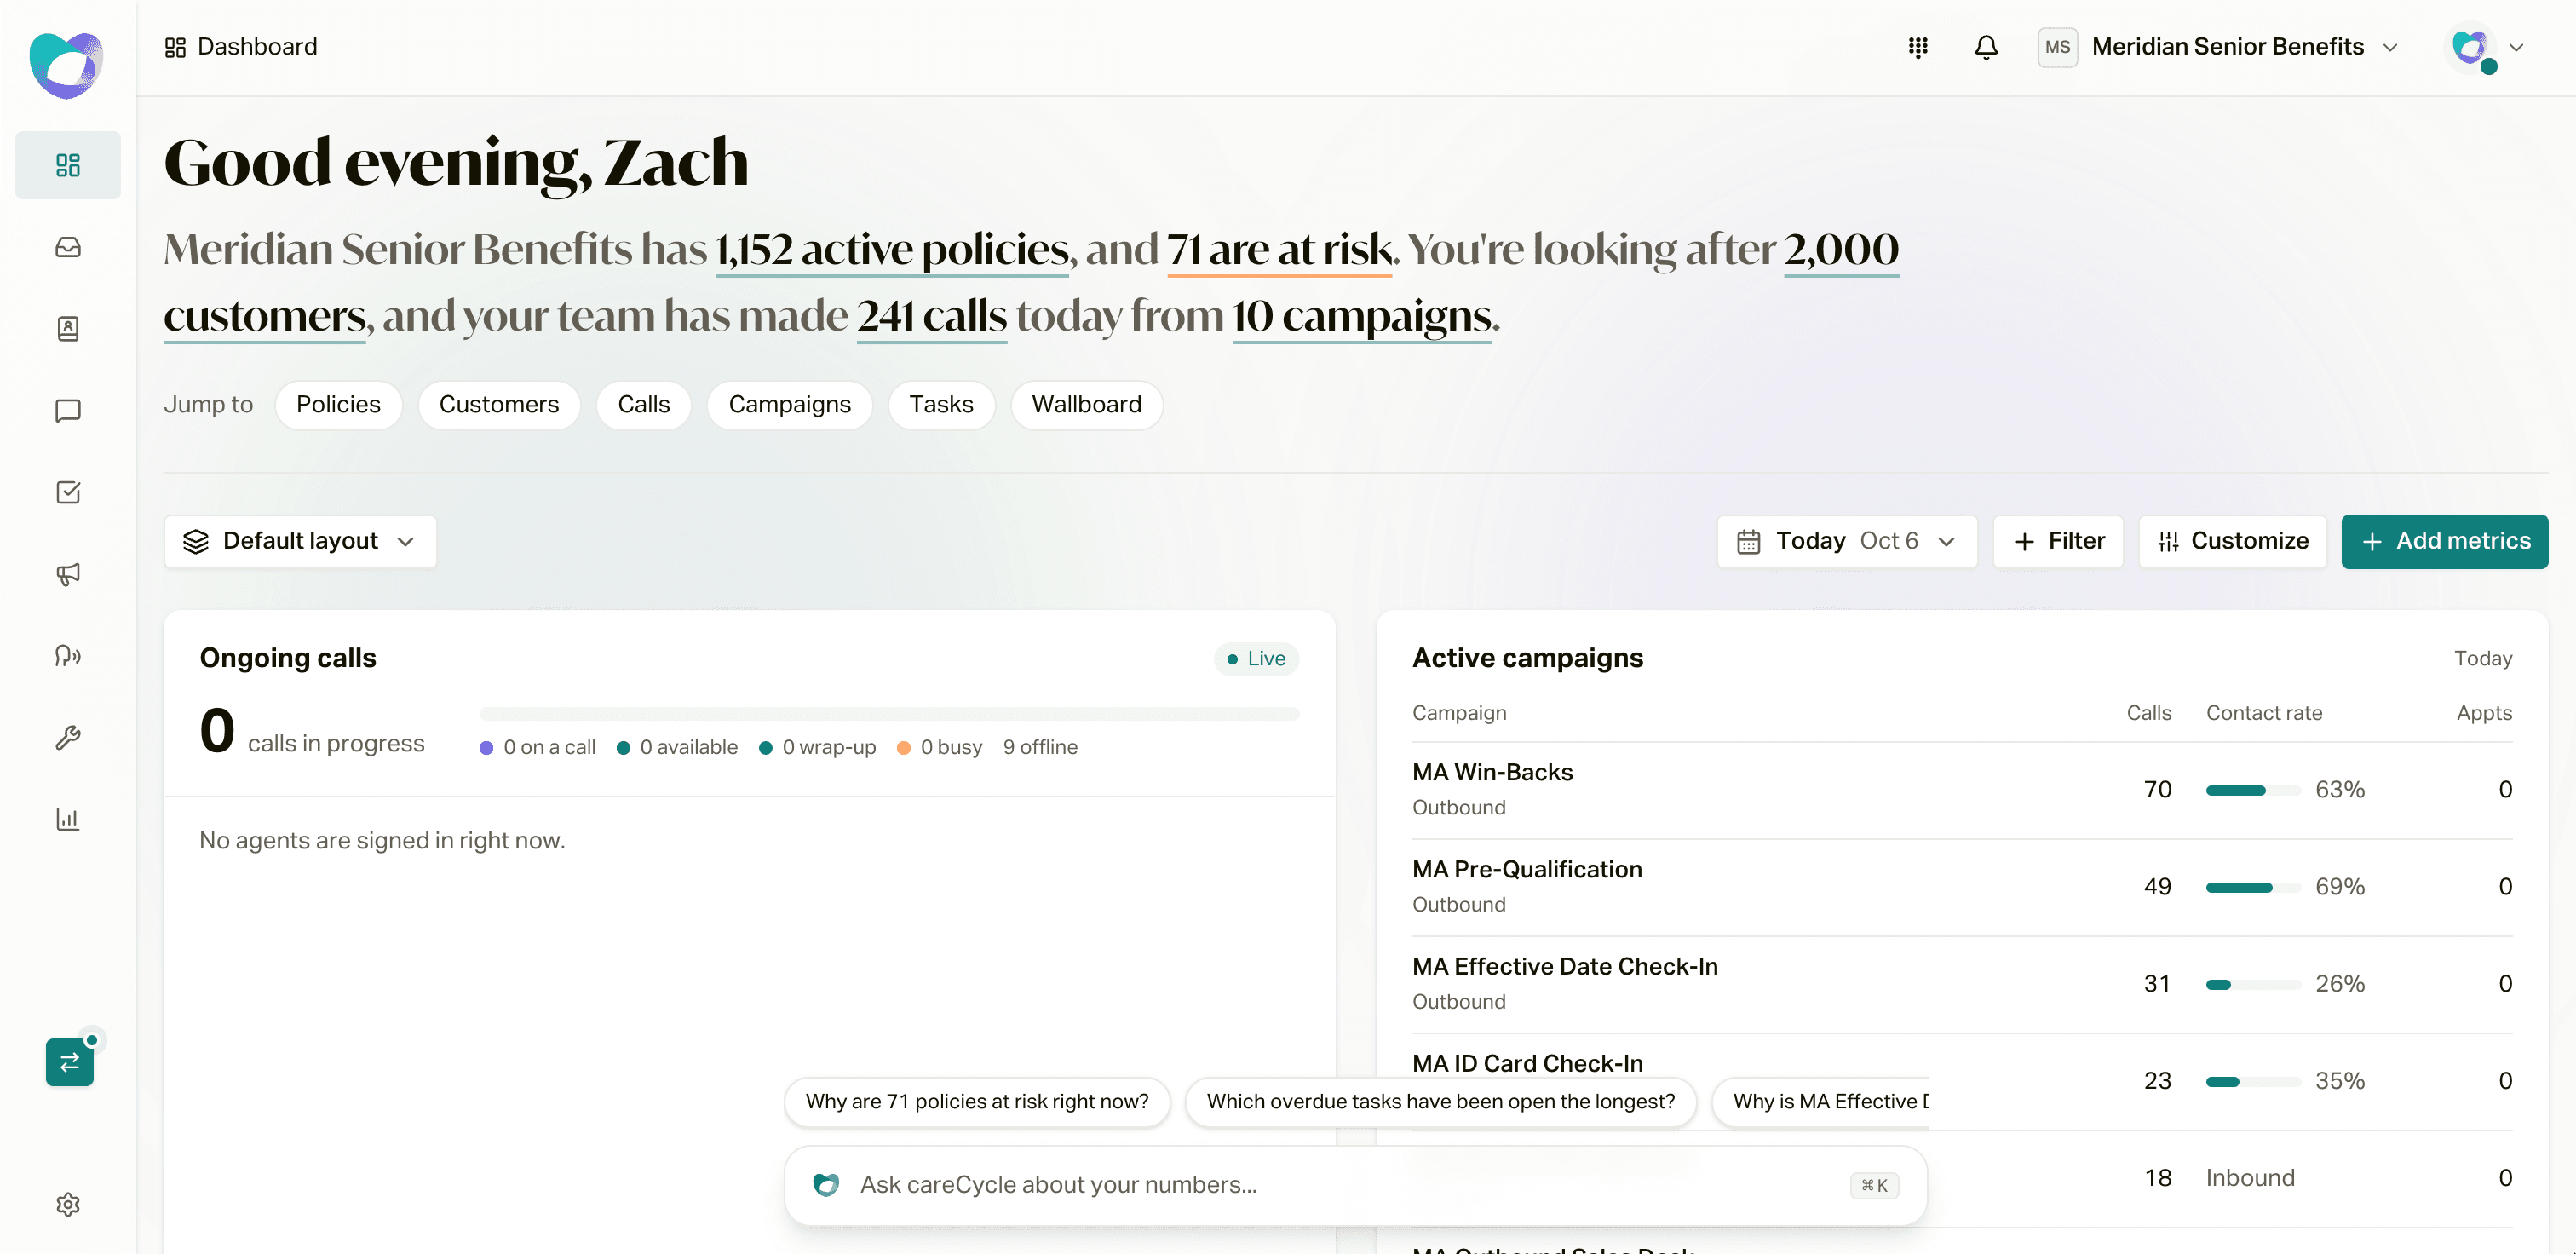
What's on Home
Top to bottom, here's what you'll see:
- A greeting. "Good morning" (or afternoon, or evening), plus a quick sentence about your book, something like "[Agency] has 4,210 active policies, and 38 are at risk. You're looking after 3,900 customers, and your team has made 212 calls today from 6 campaigns." Every number is a link: "active policies" opens your Active policies, and "at risk" opens the At Risk list on the Policies page.
- Jump to. Quick links to Policies, Customers, Calls, Campaigns, Tasks, and the Wallboard.
- A setup banner, only if you don't have any campaigns yet: "Let's get your campaigns dialing." Click Create Campaign to get going. Call and campaign numbers fill in once your first campaign is live.
- The toolbar, with your layout, dates, filters, Customize, and Add metrics.
- Your widgets. The actual numbers and charts.
- The Ask bar at the bottom: "Ask careCycle about your numbers..." Type a question and get an answer from your data. More on that below.
You only see the numbers you have access to. If your role can't see policies, for example, the policy widgets and the policy part of the greeting just don't show up.
The default layout
Until you change anything, Home shows five widgets:
| Widget | What it shows |
|---|---|
| Ongoing calls | Calls happening right now, who's On a call now, and who's been Busy the longest. Click Open wallboard for the full live view. |
| Active campaigns | Each active campaign with its calls, contact rate, and appointments for your date range. Click a campaign to open it. |
| Policies by status | Your whole book by current status. Click a status to see those policies. |
| Policies by type | Your book split by Medicare Advantage, Supplement, Part D, and more. |
| Active tasks | Open tasks, what got done today, and rows for Overdue, Due today, To do, In progress, and Open requirements. |
The policy and task widgets always show your current numbers. They don't change with the date range.
Date range and filters
Dates. The date button defaults to Today. Click it to pick Today, Yesterday, Last 7 days, Last 30 days, Last 90 days, This week, This month, or Last month. You can also type a range (like "90 days", "since Jan 1", or "9/1 - 9/15") or choose Custom range... and pick days on a calendar. Two things to know:
- The max is 90 days.
- Days follow your agency's time zone, so "Today" means your agency's today, not whatever time zone you're sitting in.
Filters. Click Filter to narrow things down by Campaign, Source, Agent, or Carrier. You can pick more than one of each. Campaigns are grouped into Active, Paused, and Completed, with the most recently called first.
Not every widget cares about every filter. The toolbar only offers the date range and filters that at least one widget on your board actually uses. So if nothing on your board follows dates, you won't see the date button at all.
Your date range and filters reset to Today with no filters when you reload the page. Your layout is what sticks.
Add metrics from the library
Click Add metrics to open the library. It has metrics from every part of careCycle, grouped into sections:
| Section | Some of what's in there |
|---|---|
| Policies | Policies by status, Policies by type |
| Live operations | Ongoing calls |
| Calls | Total Calls, Customers Engaged, Avg Call Duration, Contact Rate, Total Transfers, Inbound / Outbound, Outbound voicemail rate, Call Volume, Call Dispositions, Transfer Metrics, Calls by Campaign |
| Campaigns and leads | Active campaigns, Available Leads, Leads In Distribution, Appointments Booked, Appointment Attendance, Leads by Source, Leads Created, Lead Status, Contact Rate by Source, Appointment Metrics |
| Customers | Total Customers, New This Period, Active Customers, High Intent, New Customers Over Time, Customers by Source, Customer Funnel |
| Service and inquiries | Total Inquiries, Avg Response Time, New Inquiries Over Time, Inquiries by Category, Inquiries by Status, Inquiries by Carrier |
| Tasks | Active tasks |
| Created by your team | Charts you and your team built with Ask careCycle |
You can search ("Search metrics") or narrow by type with All types, Charts, Numbers, and Tables and lists.
Each card tells you what it Follows (like Date range and Campaigns), or that it Shows Current numbers no matter what dates you pick. It also shows its default width. Click Add and it goes right onto your board. Anything already on your board says Added.
Create your own charts with Ask careCycle
Don't see the number you want? Build it. In the library, click Create your own (or Describe a metric if your board is empty), and describe what you want in plain words. For example:
Cancellations by reason, last 90 days
Contact rate by lead source this month
Appointments booked by campaign this week
Ask careCycle builds the chart from your data and shows you a preview first. Nothing goes on your dashboard until you say so. From the preview you can:
- Refine it by typing in the chat, like "split by carrier." To change the chart, you always just describe the change.
- Pick a width: 1 column, 2 columns, or Full width.
- Name it.
- Share it by checking "Share with your team so other admins can add it from the library."
Click Add to dashboard and you're good to go. The chart updates as your data changes. Ask careCycle picks the kind of chart that fits, and if you want a different one (line, bar, area, pie, or a single number), just ask.
You can also type a search in the library that doesn't match anything and click Create "[your search]" with Ask careCycle. Same thing, one less click.
Charts you build with Ask careCycle follow the date range when your question is about one period, like "policies written this month." The chart's header names the date it counts by, like Submitted date. Charts that compare periods or cover a set span keep the dates you asked for. Ask charts don't use the filters.
Sharing and deleting your charts
Charts you build show up in the library under Created by your team. Each one says who it belongs to: "Yours, shared with your team," "Yours, only you can see it," or who shared it. On your own charts, click Share with team or Make private to switch.
To get rid of a chart for good, use the delete button on its card. Heads up: deleting a shared chart removes it from every dashboard it's on, including your teammates'.
Pin charts from Ask careCycle
You don't have to start in the library. Anywhere you're using Ask careCycle (the Ask bar on Home, the search bar at the top of the app, or Cmd/Ctrl+K), you can ask a question, and if the answer comes back as a chart, hover over it and click the pin (Add to dashboard). It lands on your Home board.
Ask careCycle also has a Saved charts tab with the charts you've saved and the ones your team has shared.
Ask careCycle answers questions about your numbers and how things work. It doesn't change anything in your account.
Make it yours
Click Customize (on a computer, not your phone). The toolbar switches to "Editing your layout," and now you can:
- Drag widgets around by their grip.
- Change the width of charts and tables (1 to 4 columns, depending on the widget).
- Stack two single-number widgets into one spot (Choose KPI to stack with).
- Remove a widget with the trash button.
When you're done, click Save and finish. Cancel throws away your changes, and Reset to default puts the careCycle default back.
If you remove everything, you'll see "Build your dashboard" with buttons to Add metrics, Describe a metric, or Restore the default layout.
Your layout vs the shared layout
The layout button on the left of the toolbar tells you which layout you're looking at: Your layout, Shared layout, or Default layout. Click it to see all three. Home shows the first one that exists:
- Your layout. Only you see it. You get one as soon as you customize or add a metric.
- Shared with all admins. What admins see if they haven't saved their own.
- careCycle default. Used until somebody saves a layout.
Layouts are saved to your account, so they follow you to any browser.
From that same menu:
- Save for all admins makes what you see now the shared layout. Admins who already have their own layout keep theirs. You need the Edit shared dashboard permission for this (Owners and Admins have it). Heads up: if your layout has private Ask careCycle charts in it, they become visible to your organization.
- Reset my layout deletes your layout so you see the shared one (or the default) again.
The agent dashboard
Everyone without Home dashboard access gets the agent dashboard. It's built around their day:
- Action items up top: overdue inquiries, overdue tasks, things due today, and new inquiries.
- Your upcoming appointments.
- Monthly numbers (pick a month, defaults to This Month): Customer Connections, Talk Time, Inquiries Resolved, and Assigned Tasks Completed.
- Today's queue: Priority Threads, In Progress Threads, Overdue Tasks, and Overdue Inquiries.
The full walkthrough for agents is in Your Dashboard and Tasks.
Where the old stuff went
If you used the old dashboard with the Sales and Retention tabs, most of those numbers are in the library now. A few moved:
- Per-source numbers live on the Sources page and Wallboard > Sources. See Source Tracking.
- Live agent activity is on the Wallboard.
- Call reporting and queues are on Calls > Overview (Call Analytics and Queues & Callbacks). See Calls, Customers, and Exports.